We use cookies and other tracking technologies to improve your browsing experience on our website, to show you personalized content and targeted ads, to analyze our website traffic, and to understand where our visitors are coming from.
⚠️
GDPR & Cookie Policy Notice
In accordance with data protection regulations; the use of mandatory cookies is required for the core functions of our website to operate, ensure data security, and perform analytics. If you reject the use of cookies, it is not possible to benefit from the services on our website due to technical limitations and data synchronization interruptions. You must consent to the use of cookies to access the content on our site.
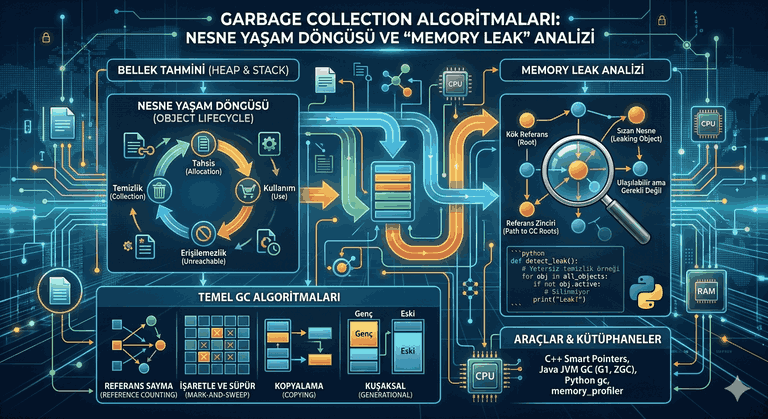
Garbage Collection Algorithms: Object Lifecycle and Memory Leak Analysis
Memory management is one of the most critical layers in modern software architectures that directly affects system performance and application stability. Garbage Collection (GC) is a mechanism developed to minimize errors that may arise from manual memory management (malloc/free or new/delete) by tracking the lifecycle of dynamically allocated objects.
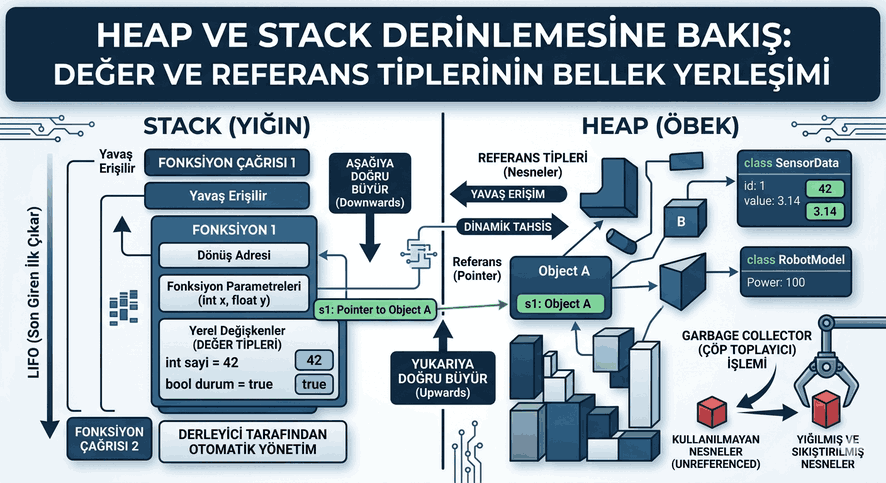
An object’s lifecycle begins with memory allocation at runtime. In modern languages (Java, C#, Go, Python), this process typically occurs in the Heap area.
Allocation: The amount of bytes required for the object is calculated, and a suitable address range is reserved in memory.
Reachability: For an object to be considered “alive,” it must be reachable through a chain of references starting from Root references (Stack variables, static variables, CPU registers).
Finalization: The stage where the object releases its resources (closing files, terminating sockets, etc.) before being deleted from memory.
Deallocation: Clearing the space occupied by the object to make it available for new allocations.
2. Basic Garbage Collection Algorithms
Garbage collection processes follow different strategies to optimize performance and reduce “Stop-the-World” (STW) pauses.
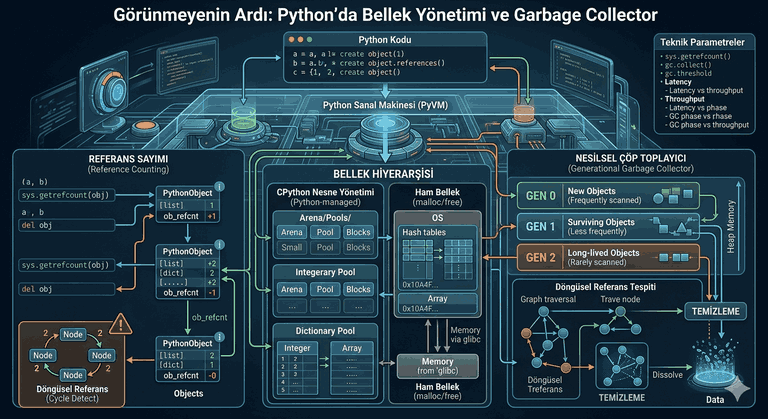
2.1. Reference Counting
Each object holds a counter that tracks how many different points refer to it. When the counter drops to zero, the object is immediately deleted.
Advantage: Memory is freed instantly; there are no large pauses.
Disadvantage: It cannot resolve circular dependencies. If two objects point to each other, their counters will never drop to zero even if they have no other counterparts in the program.
2.2. Mark-and-Sweep
This algorithm consists of two stages:
Mark: Starting from GC roots, all reachable objects are marked as “alive.”
Sweep: All unmarked objects are cleared from memory.
2.3. Copying Algorithm
Memory is divided into two equal parts (Semi-space). When one side is full, only live objects are sequentially copied to the other side. The old area is completely cleared.
Critical Note: This method prevents memory fragmentation but reduces available memory space by half.
It is based on the “most objects die young” (Infant Mortality) principle in the software world. Memory is divided into generations:
Young Generation (Eden Space): Newly created objects go here. Frequent but fast cleaning is performed (Minor GC).
Old Generation (Tenured): Objects that survive for a certain period are moved here. Less frequent but more comprehensive cleaning is performed (Major/Full GC).
3. Memory Leak Analysis
In a managed memory structure, a memory leak is technically the persistence of objects in memory that are reachable but no longer needed according to the program’s logic.
3.1. Sources of Leaks
Unused Static Fields: Objects added to static collections are not cleared as long as the Class Loader is active.
Unclosed Resources: Database connections or stream structures that are not closed.
Inner Class References: An inner class of an outer class can inadvertently hold a hidden reference to the outer class.
Listener and Callback Registrations: If event listeners are not unregistered after being registered, they lead to leaks.
3.2. Technical Analysis and Profiling
To detect memory leaks, Heap Dump analysis must be performed. Through object histograms, it is examined which class has how many instances remaining in memory and through which reference chain (Path to GC Roots) they are kept alive.
4. Programming Language-Based Implementations and Libraries
4.1. C++ and Smart Pointers (RAII)
In C++, std::unique_ptr and std::shared_ptr are used to automate manual management.
#include<iostream>#include<memory>classResource {
public: Resource() { std::cout <<"Resource created\n"; }
~Resource() { std::cout <<"Resource destroyed\n"; }
};
voidscopeTest() {
// shared_ptr working with Reference Counting principle
std::shared_ptr<Resource> ptr1 = std::make_shared<Resource>();
{
std::shared_ptr<Resource> ptr2 = ptr1; // Reference count becomes 2
std::cout <<"Reference count: "<< ptr1.use_count() <<"\n";
} // ptr2 is out of scope, reference count is 1
std::cout <<"Reference count: "<< ptr1.use_count() <<"\n";
} // ptr1 is out of scope, reference count is 0 and destructor is called
4.2. Java and JVM Garbage Collectors
The JVM offers different GC implementations that can be chosen according to needs:
G1 (Garbage First): Divides memory into regions and prioritizes the region containing the most garbage.
ZGC: A modern collector that targets very low latency and can scan TB-level memory within milliseconds.
4.3. Python and gc Module
Python primarily uses Reference Counting, but runs a cyclic garbage collector in the background to resolve circular references.
import gc
classNode:
def__init__(self, name):
self.name = name
self.next =Nonedefcreate_cycle():
n1 = Node("A")
n2 = Node("B")
n1.next = n2
n2.next = n1 # Circular reference (Memory Leak candidate)create_cycle()
# Normally n1 and n2 are out of scope but they are not cleared because they hold each othergc.collect() # Circular references are cleared with manual trigger
5. Performance Optimization Strategies
To reduce the GC load in system architecture, the following technical approaches should be adopted:
Object Pooling: Creating a reusable pool for objects that are frequently created and destroyed (e.g., bullet objects or database connections).
Immutable Objects: Immutable objects optimize write barriers and assist the GC in generational transitions.
Large Object Heap (LOH) Management: Since very large objects lead to memory fragmentation, their lifespan and allocation frequency should be kept under control.
Tuning: Memory limits appropriate to the application’s characteristic structure should be determined with JVM parameters (e.g., -XX:+UseG1GC, -Xms, -Xmx).
6. Conclusion and Technical Assessment
Although Garbage Collection protects the developer from low-level memory errors, knowing the algorithm’s working logic is essential for efficient use of system resources. Minimizing “Stop-the-World” durations, choosing correct data structures, and lifecycle analysis are indispensable for the performance sustainability of high-traffic and mission-critical systems. Especially in real-time systems, the deterministic nature of GC pauses is the main factor determining the service level agreement (SLA) of the application.
Technical Notes:
Fragmentation: The situation where memory is divided into small pieces, and a contiguous area cannot be found for a large object.
Root Set: A set of directly accessible references such as local variables, active threads, and static fields.
Safe Points: Safe points where the application can be paused for the GC process to begin.