We use cookies and other tracking technologies to improve your browsing experience on our website, to show you personalized content and targeted ads, to analyze our website traffic, and to understand where our visitors are coming from.
⚠️
GDPR & Cookie Policy Notice
In accordance with data protection regulations; the use of mandatory cookies is required for the core functions of our website to operate, ensure data security, and perform analytics. If you reject the use of cookies, it is not possible to benefit from the services on our website due to technical limitations and data synchronization interruptions. You must consent to the use of cookies to access the content on our site.
Observability: System Health via Logging, Metrics, and Tracing
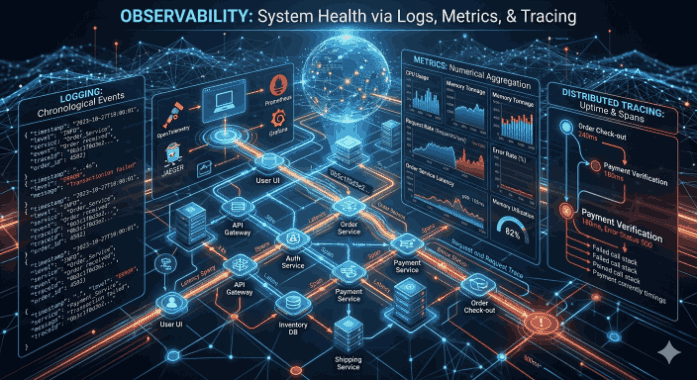
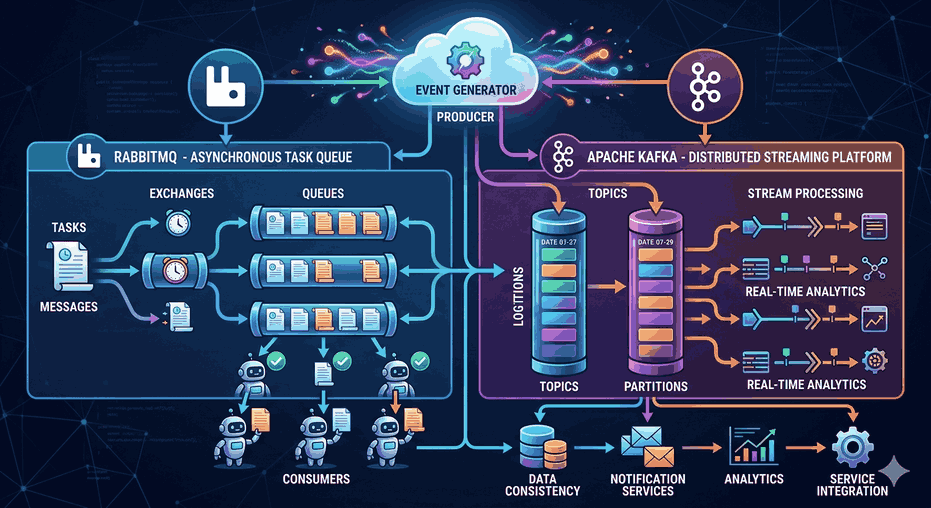
The complexity of microservice architectures and cloud computing ecosystems has made it impossible to monitor systems merely by checking if they are “up” or “down.” Traditional monitoring focuses on the external outputs of a system; Observability, however, is the ability to understand the internal state of a system through the data it produces (telemetry). For a system to be observable, it must rely on three pillars: Logs, Metrics, and Tracing.
Figure 1: Observability: System Health via Logging, Metrics, and Tracing.
1. Logging: Chronological Record of Events
Logging consists of text-based records of discrete events that occurred within the system over a specific period. It is the most fundamental data source for answering the “why” question when an error occurs.
Structured Logging
In modern systems, keeping logs only as plain text makes analysis difficult. Instead, structured logs in JSON format are preferred.
Technical Note: Correct usage of log levels (DEBUG, INFO, WARN, ERROR, FATAL) is critical for optimizing storage costs and reducing alert fatigue.
2. Metrics: Numerical Aggregation and Performance Analysis
Metrics are time-series data. They allow us to track the health of a system through numerical values (CPU usage, memory consumption, requests per second). The greatest advantage of metrics is their low storage cost and high query speed.
Metric Types
Counter: Values that only increase (e.g., Total HTTP requests).
Gauge: Values that can fluctuate up or down instantly (e.g., Active queue length).
Histogram: Distribution of data according to specific ranges (buckets) (e.g., Response times / Latency).
Prometheus and Python (prometheus_client) Usage:
from prometheus_client import start_http_server, Summary, Counter
import random
import time
# Histogram/summary tracking request durationREQUEST_TIME = Summary('request_processing_seconds', 'Description of processing time')
# Counter counting failed operationsERROR_COUNT = Counter('order_processing_errors_total', 'Total error count')
@REQUEST_TIME.time()
defprocess_request(t):
time.sleep(t)
if random.random() <0.1:
ERROR_COUNT.inc()
if __name__ =='__main__':
start_http_server(8000)
whileTrue:
process_request(random.random())
3. Distributed Tracing
This is the process of tracking the journey of a request end-to-end as it travels through dozens of different communicating services. A unique Trace ID is created for each request, and each service adds its own Span ID while processing this request.
OpenTelemetry (OTel) Standard
OpenTelemetry, which has become the standard in the observability world today, offers a common protocol for collecting telemetry data from different programming languages.
According to Google SRE (Site Reliability Engineering) principles, the observability of a system should be based on these four criteria:
Latency: The time it takes to process a request.
Traffic: The load coming into the system (HTTP requests, bandwidth).
Errors: The rate of failed requests (5xx codes, timeouts).
Saturation: How much of the resources are being used (CPU, I/O, Disk).
6. Advanced Observability Techniques and Notes
Context Propagation
The most critical issue in distributed tracing is the propagation of Trace ID information from one service to another via HTTP headers or gRPC metadata. Typically, W3C Trace Context standards are used (traceparent header).
Sampling
In high-traffic systems, tracing every request creates a significant performance overhead and storage cost. Therefore:
Head-based Sampling: A decision is made when the request begins whether to trace it or not.
Tail-based Sampling: A decision is made after the process is finished (e.g., only if it failed or is slow) whether to record it.
7. Conclusion and Architectural Strategy
Observability is not just adding tools to a system; it is an engineering culture. Logs answer “what happened,” metrics answer “where is the problem,” and tracing answers “where did the problem start and how did it propagate.”
For an effective strategy:
A standard log format (JSON) should be used in all services.
Meaningful metrics should be collected (not just CPU, but business logic metrics as well).
Distributed tracing must be implemented on critical paths.
Visualization dashboards should be designed to show system bottlenecks at a glance.
The correlation of these three data types (Logs, Metrics, Traces) maximizes system availability by reducing root cause analysis (RCA) to the order of seconds during an incident.