We use cookies and other tracking technologies to improve your browsing experience on our website, to show you personalized content and targeted ads, to analyze our website traffic, and to understand where our visitors are coming from.
⚠️
GDPR & Cookie Policy Notice
In accordance with data protection regulations; the use of mandatory cookies is required for the core functions of our website to operate, ensure data security, and perform analytics. If you reject the use of cookies, it is not possible to benefit from the services on our website due to technical limitations and data synchronization interruptions. You must consent to the use of cookies to access the content on our site.
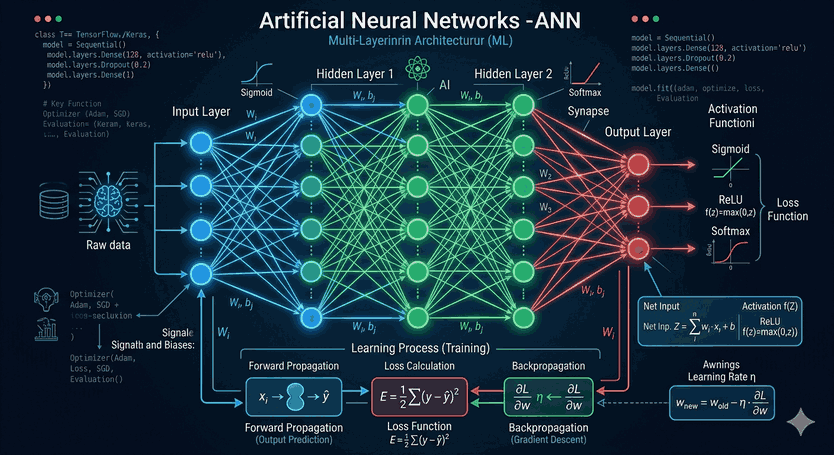
Advanced Data Preprocessing and Algorithmic Optimization Strategies in Machine Learning Pipelines
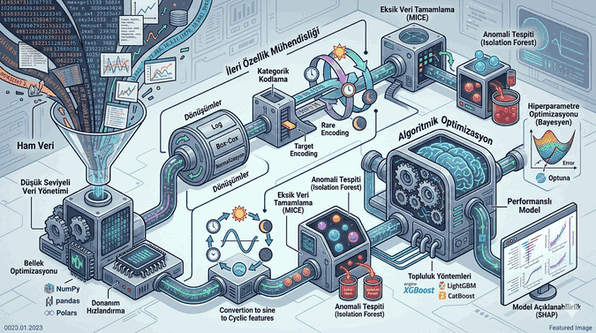
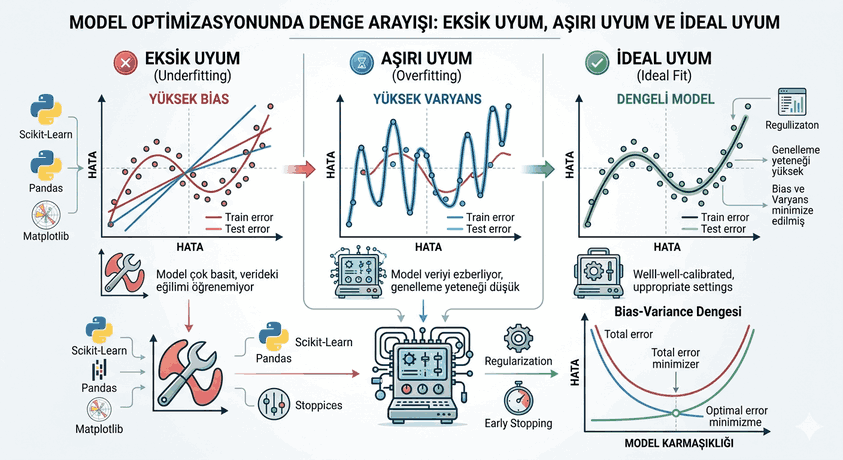
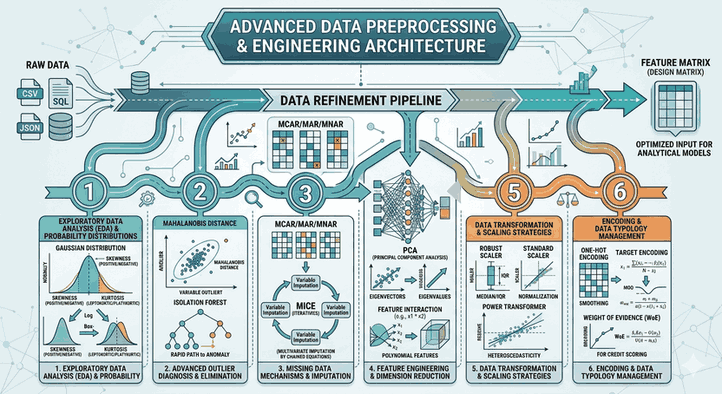
In modern data science and machine learning pipelines, processing raw data and preparing it for the modeling stage constitutes approximately 80% of the total project time. In this process, it is essential not only to call library functions but also to understand the statistical distribution of the data and the mathematical expectations of the algorithms. Below, advanced data analytics processes are covered comprehensively with technical details and application code.
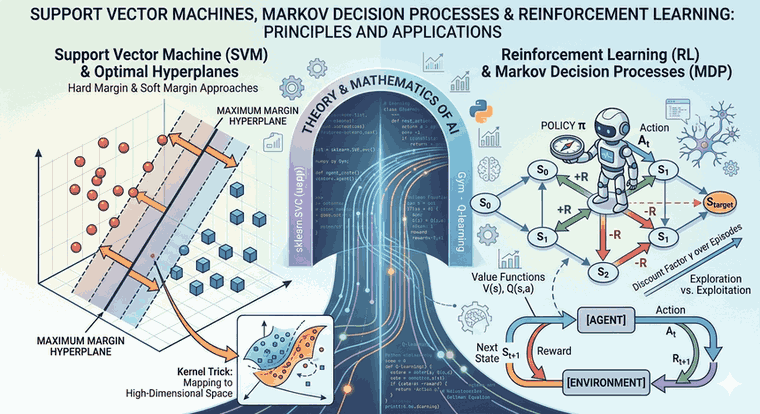
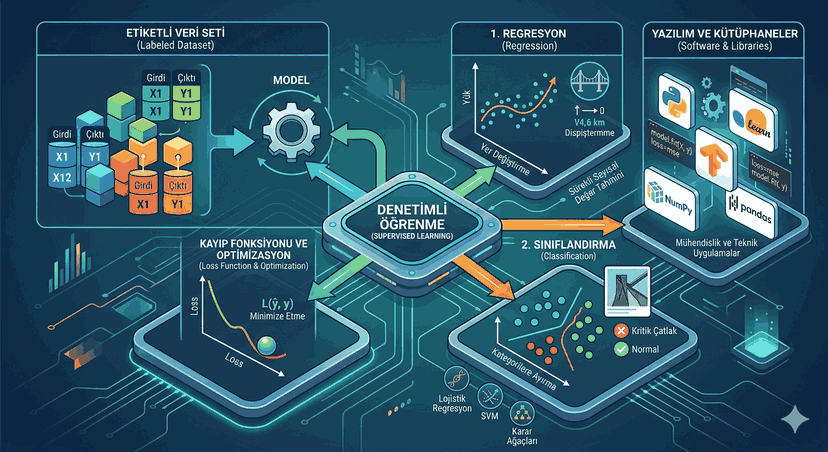
Figure 1: Advanced Data Preprocessing and Algorithmic Optimization Strategies in Machine Learning Pipelines.
1. Advanced Feature Engineering
Feature engineering is the art of using domain knowledge and mathematical transformations to uncover hidden patterns in data.
Variable Transformations and Distribution Optimization
Linear models assume that data is normally distributed and the relationship between variables is linear. If your data is right-skewed, a Log or Power Transformer (Box-Cox, Yeo-Johnson) should be applied to increase the model’s learning capacity.
import pandas as pd
import numpy as np
from scipy import stats
from sklearn.preprocessing import PowerTransformer
# Removing skewness from datapt = PowerTransformer(method='yeo-johnson')
df['target_transformed'] = pt.fit_transform(df[['target_variable']])
# Logarithmic transformation (adding 1 for zero values)df['feature_log'] = np.log1p(df['feature_column'])
Vectorization of Categorical Variables
Standard One-Hot Encoding leads to the “curse of dimensionality” in high-cardinality columns (those with a large number of unique classes). Instead, Target Encoding, which is based on the mean of the target variable, or weighted Rare Encoding should be used.
from category_encoders import TargetEncoder
# Target Encoding implementation# Fit only on the train set to prevent Data Leakageencoder = TargetEncoder(cols=['city', 'occupation'])
df_encoded = encoder.fit_transform(X_train, y_train)
2. Statistical Imputation of Missing Data and Outliers
Filling missing values only with the mean artificially reduces the variance in the data. Instead, an Iterative Imputer (MICE algorithm), which uses correlations between variables, should be preferred.
Multivariate Missing Data Imputation
IterativeImputer models each variable as a function of the others and estimates the missing values.
from sklearn.experimental import enable_iterative_imputer
from sklearn.impute import IterativeImputer
from sklearn.ensemble import RandomForestRegressor
# Random Forest-based MICE imputationit_imputer = IterativeImputer(estimator=RandomForestRegressor(), max_iter=10, random_state=42)
df_imputed = it_imputer.fit_transform(df)
Robust Analysis of Outliers
For outlier detection, rather than Z-Score, a more robust approach based on the median, such as Modified Z-Score or Isolation Forest, should be used. Isolation Forest identifies anomalies by looking at the number of splits required to isolate the data.
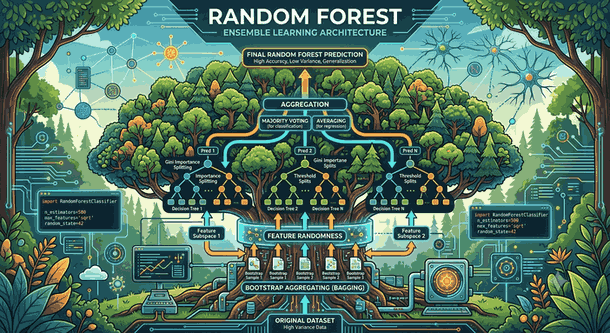
In modern analytical approaches, structures that combine the predictions of multiple models (Ensemble Learning) have become standard instead of using a single model.
Gradient Boosting Machines (GBM) and Optimization
XGBoost, LightGBM, and CatBoost algorithms minimize the error function by performing gradient-based optimization. In these models, early_stopping_rounds and regularization (L1/L2) parameters play a critical role in preventing overfitting.
4. Hyperparameter Optimization and Bayesian Approach
Instead of brute-force methods like GridSearch, Bayesian Optimization (such as the Optuna library), which searches for the best parameters through a probabilistic model, should be used. This method scans the search space more intelligently by learning from previous trials.
5. Model Evaluation and Business Decision Mechanisms
Looking only at Accuracy or R-Squared values can be misleading. For classification problems, the Precision-Recall Curve and F1-Score should be analyzed, while for regression, MAE (Mean Absolute Error) and RMSE (Root Mean Squared Error) should be analyzed together.
SHAP (SHapley Additive exPlanations): Uses game theory to explain why a model gives importance to a particular feature. It enables the transparency of black-box models (XGBoost, etc.).
Permutation Importance: Measures the true impact by seeking an answer to how much model performance drops when the values of a feature are randomly shuffled.
Technical Library References
Data Manipulation:Pandas, NumPy, Polars (for high-performance data processing).
In conclusion, an advanced data analysis process is a combination of mathematical rigor and programming competence. Every step from data preprocessing to deploying the model to production must be managed with a systematic engineering discipline.