We use cookies and other tracking technologies to improve your browsing experience on our website, to show you personalized content and targeted ads, to analyze our website traffic, and to understand where our visitors are coming from.
⚠️
GDPR & Cookie Policy Notice
In accordance with data protection regulations; the use of mandatory cookies is required for the core functions of our website to operate, ensure data security, and perform analytics. If you reject the use of cookies, it is not possible to benefit from the services on our website due to technical limitations and data synchronization interruptions. You must consent to the use of cookies to access the content on our site.
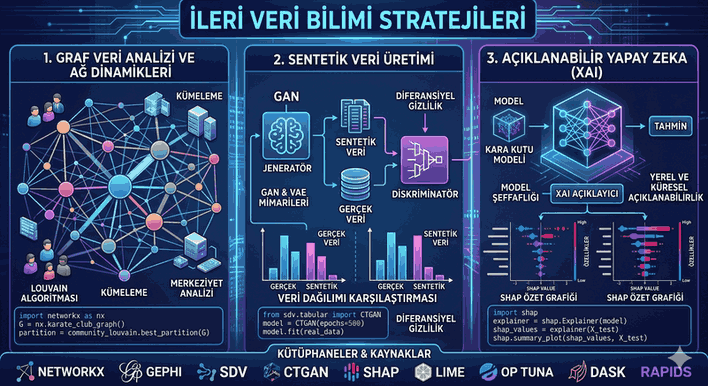
Advanced Data Science Strategies: Graph Analytics, Synthetic Data, and XAI Architectures
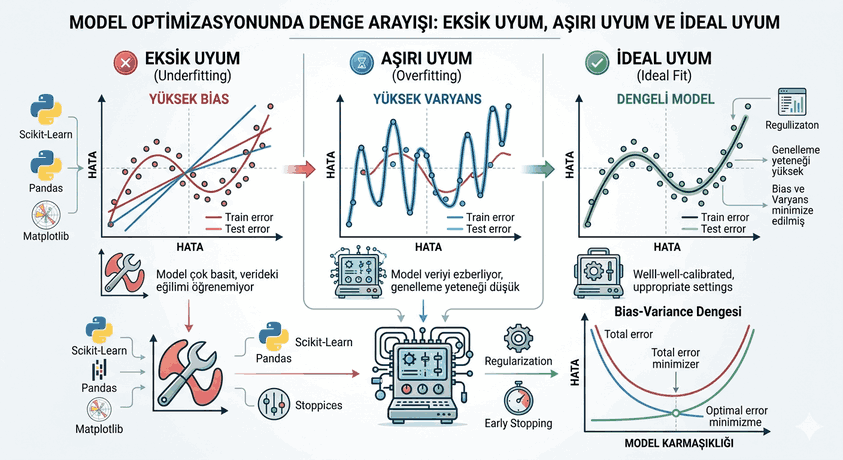
In the current data science ecosystem, moving beyond standard regression or classification models to focus on the structural, derived, and explainable dimensions of data forms the foundation of modern analytical strategies. In this article, we will delve into the analysis of complex network structures, synthetic data generation to counter data scarcity, and Explainable AI (XAI) techniques that ensure model transparency.
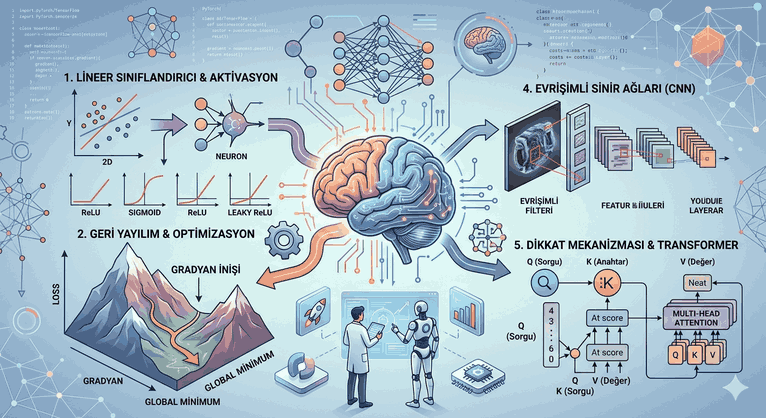
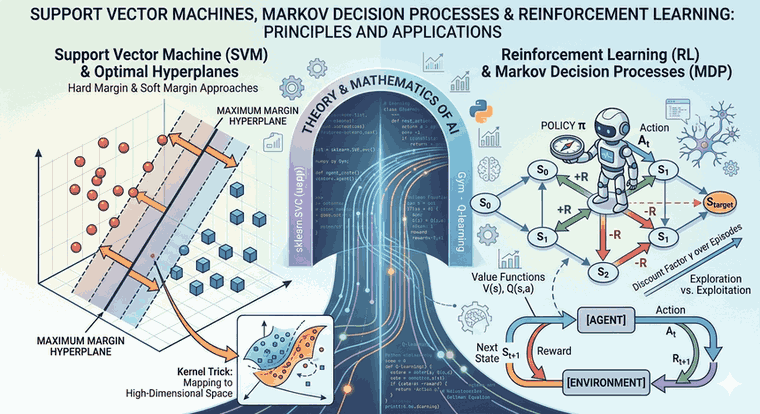
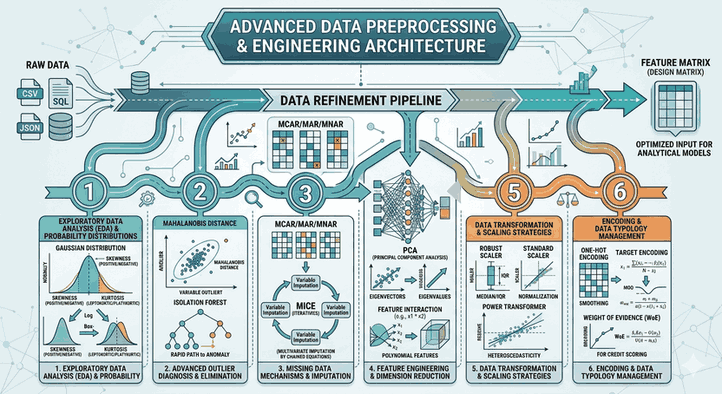
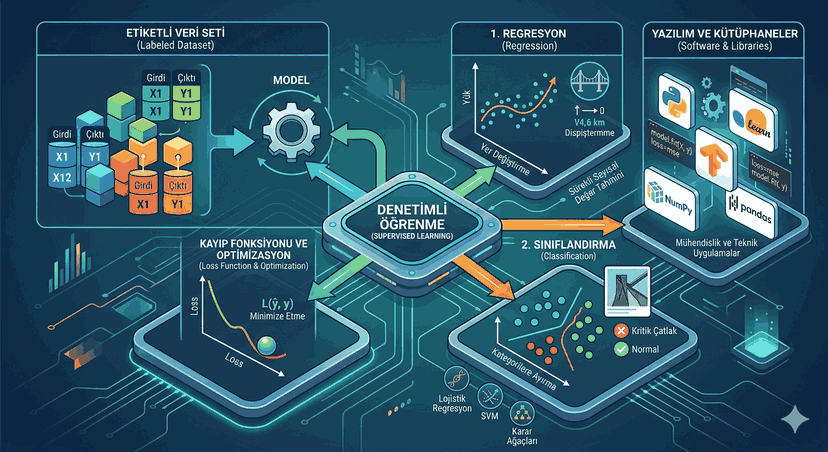
Figure 1: Advanced Data Science Strategies: Graph Analytics, Synthetic Data, and XAI Architectures.
1. Graph Data Analysis and Network Dynamics
Traditional tabular data is insufficient to represent the relational depth between entities. Graph theory models data as nodes and edges, revealing hidden structures and community clusters within the system.
Community Detection and Algorithmic Approaches
One of the most critical stages in network analysis is identifying sub-groups where nodes are more densely connected among themselves and more sparsely connected to the outside.
Louvain Algorithm: A hierarchical clustering method based on modularity optimization. It demonstrates high performance in large-scale graphs.
Girvan-Newman: By focusing on edge betweenness values, it removes edges serving as “bridges” in the network and isolates natural communities.
PageRank: Scores the importance of nodes within the network based on the quality of incoming connections.
Technical Implementation: Analysis with NetworkX
In the Python ecosystem, NetworkX is one of the most powerful libraries for manipulating graph structures.
import networkx as nx
import matplotlib.pyplot as plt
from community import community_louvain
# Loading data and creating a graphG = nx.karate_club_graph()
# Modularity-based community detection (Louvain)partition = community_louvain.best_partition(G)
# Centrality analysis (Betweenness Centrality)centrality = nx.betweenness_centrality(G)
# Visualization preparationpos = nx.spring_layout(G)
plt.figure(figsize=(10, 7))
nx.draw_networkx_nodes(G, pos, partition.keys(), node_size=100,
node_color=list(partition.values()), cmap=plt.cm.RdYlBu)
nx.draw_networkx_edges(G, pos, alpha=0.5)
plt.title("Community Detection and Clustering on Graph")
plt.show()
Note: For visualizing large-scale graphs, Gephi (Java-based) or GPU-accelerated RAPIDS cuGraph libraries have the capability to process millions of nodes in milliseconds.
2. Synthetic Data Generation and Model Robustness
Real-world data is often surrounded by problems such as KVKK/GDPR restrictions, imbalanced class distributions, or data insufficiency. Synthetic data generation is the process of creating entirely artificial but mathematically consistent datasets by preserving the statistical distribution and correlations of the original data.
GAN and VAE Architectures
The most popular approaches in synthetic data generation are Generative Adversarial Networks (GANs) and Variational Auto-Encoders (VAEs).
CTGAN (Conditional Tabular GAN): Designed to learn complex distributions of categorical and continuous variables in tabular data.
SMOTE (Synthetic Minority Over-sampling Technique): Increases minority class samples in imbalanced datasets by interpolating between neighboring points.
Technical Implementation: Using SDV (Synthetic Data Vault)
The SDV library is the industry standard for generating data in accordance with Differential Privacy principles.
from sdv.tabular import CTGAN
import pandas as pd
# Loading the existing datasetreal_data = pd.read_csv('original_dataset.csv')
# Defining and training the CTGAN modelmodel = CTGAN(epochs=500)
model.fit(real_data)
# Generating 10,000 new synthetic samplessynthetic_data = model.sample(num_rows=10000)
# Checking data quality (Statistical similarity test)from sdv.evaluation import evaluate
quality_report = evaluate(synthetic_data, real_data, metrics=['CSTest', 'KSTest'])
print(f"Synthetic Data Quality Score: {quality_report}")
Note: Synthetic data is vital, especially for simulating edge cases and subjecting models to “adversarial” tests in high-risk fields like autonomous driving systems.
3. Explainable Artificial Intelligence (XAI): Making Black-Box Models Transparent
Although deep learning models and complex ensemble algorithms (XGBoost, LightGBM) offer high accuracy, they struggle to explain the logic behind their decisions. XAI builds trust and ensures compliance with regulations by making these models interpretable.
Local and Global Explainability Methods
SHAP (SHapley Additive exPlanations): Based on game theory. It fairly distributes the contribution (positive or negative) of each feature to the prediction.
LIME (Local Interpretable Model-agnostic Explanations): Explains a specific prediction of a complex model by building a local, simpler, and linear model around that prediction.
Partial Dependence Plots (PDP): Shows the marginal effect of changing a feature on the target variable.
Technical Implementation: Feature Contribution Analysis with SHAP
import shap
import xgboost as xgb
from sklearn.model_selection import train_test_split
# Model trainingX, y = shap.datasets.boston()
X_train, X_test, y_train, y_test = train_test_split(X, y, test_size=0.2)
model = xgb.XGBRegressor().fit(X_train, y_train)
# Calculating SHAP valuesexplainer = shap.Explainer(model)
shap_values = explainer(X_test)
# Summary plot: Visualizing the general impact of all featuresshap.summary_plot(shap_values, X_test)
# Waterfall plot: Detailed analysis of a single predictionshap.plots.waterfall(shap_values[0])
Note: XAI techniques are not only for engineering but are also mandatory in critical sectors like healthcare and finance to audit models for bias.
4. Advanced Analytical Libraries and Hardware Optimization
In data science projects, it may be necessary to go beyond standard libraries to overcome performance bottlenecks:
Dask: Parallelizes Pandas operations to process large datasets (Big Data) that exceed RAM capacity.
Optuna: An efficient library that uses Bayesian techniques for hyperparameter optimization.
ONNX (Open Neural Network Exchange): Makes models portable between different frameworks (PyTorch, TensorFlow) and enables high-performance inference.
Notes on System Architecture
In large-scale data analytics processes, the use of a Feature Store accelerates model training processes. Tools like Feast or Hopsworks enable the versioning of processed data, allowing for reuse across different projects.
Conclusion and Evaluation
Grasping the structural context of data with graph analysis, overcoming limitations with synthetic data, and building trust with XAI are the sharpest weapons in a modern data scientist’s arsenal. When these techniques are combined, systems are built that not only make predictions but also generate strategic insights and are accountable. At the software layer, the correct integration of libraries such as NetworkX, CTGAN, and SHAP is the essential bridge that transforms academic theory into industrial solutions.