We use cookies and other tracking technologies to improve your browsing experience on our website, to show you personalized content and targeted ads, to analyze our website traffic, and to understand where our visitors are coming from.
⚠️
GDPR & Cookie Policy Notice
In accordance with data protection regulations; the use of mandatory cookies is required for the core functions of our website to operate, ensure data security, and perform analytics. If you reject the use of cookies, it is not possible to benefit from the services on our website due to technical limitations and data synchronization interruptions. You must consent to the use of cookies to access the content on our site.
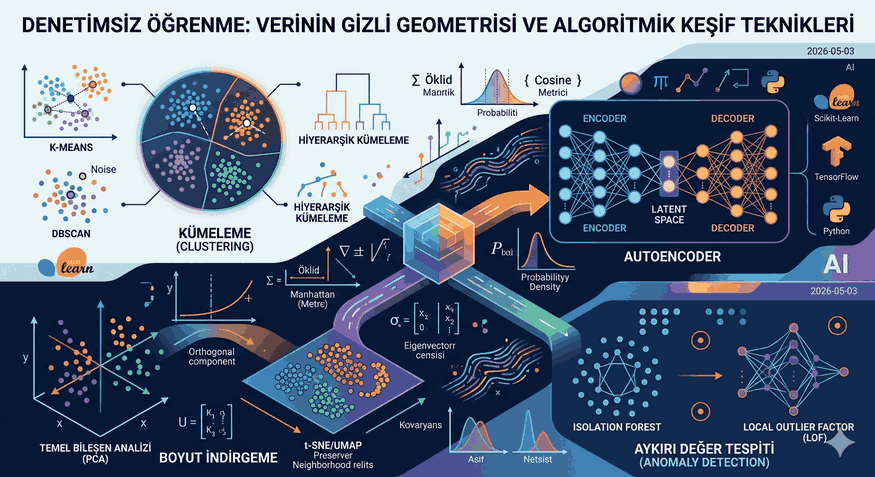
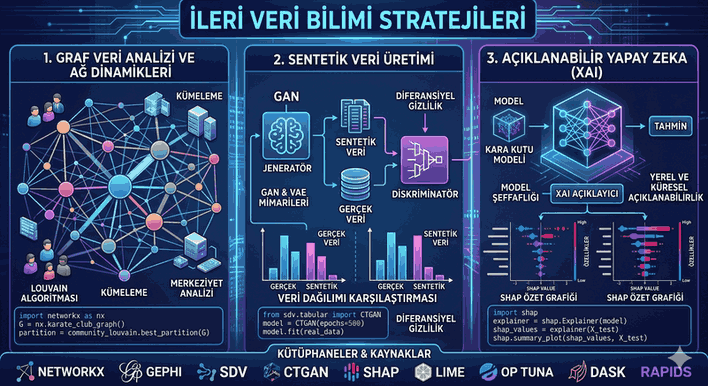
Unsupervised Learning: The Hidden Geometry of Data and Algorithmic Discovery Techniques
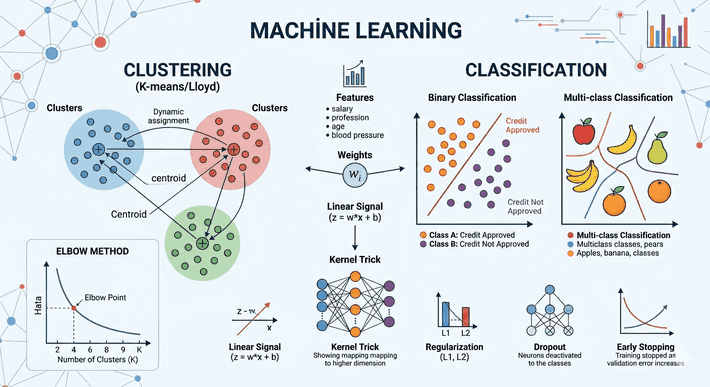
Unsupervised Learning is one of the most sophisticated and exploratory fields of data science. Unlike traditional supervised learning methodologies, here the system derives meaningful correlations by analyzing the topological structure and statistical distribution of raw data without the aid of a “teacher” (target labels). This article examines a broad technical spectrum, from clustering algorithms to dimensionality reduction techniques, and from modern library implementations to the underlying mathematical background.
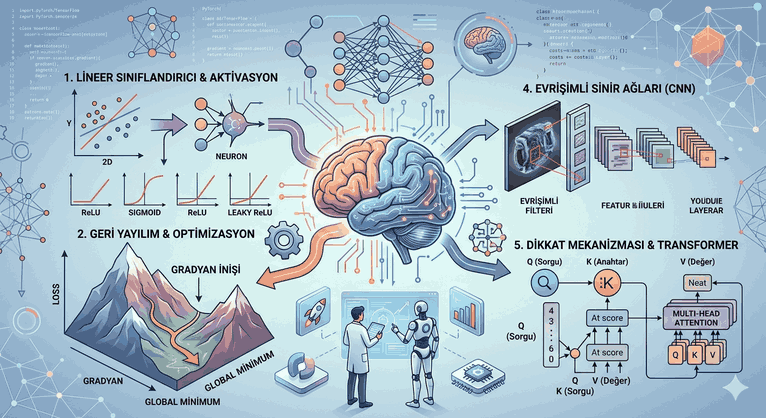
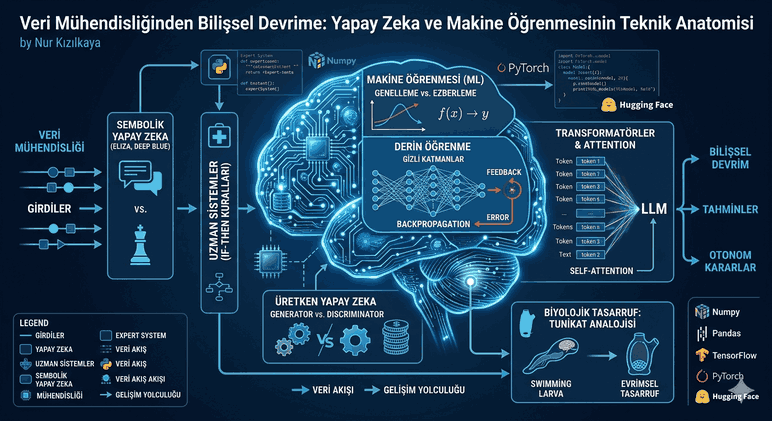
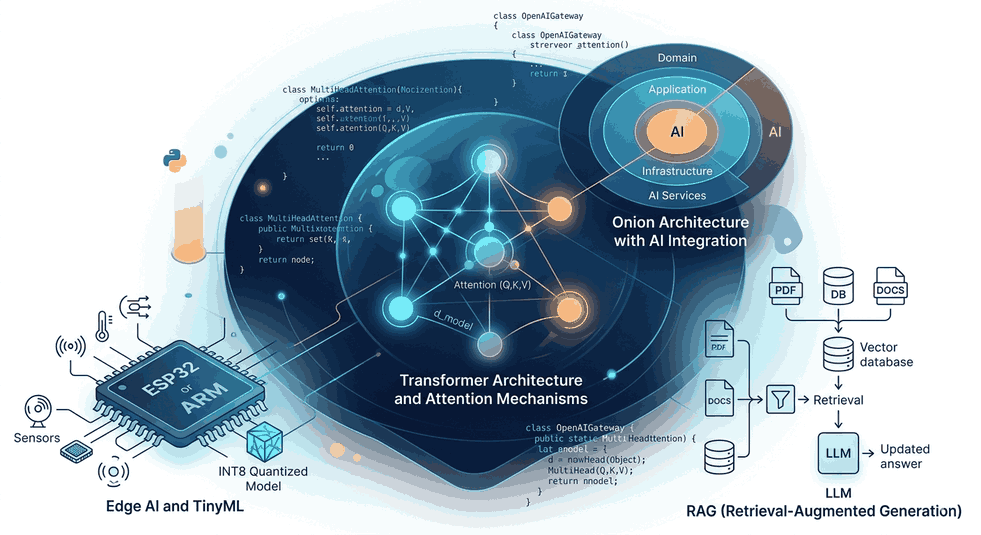
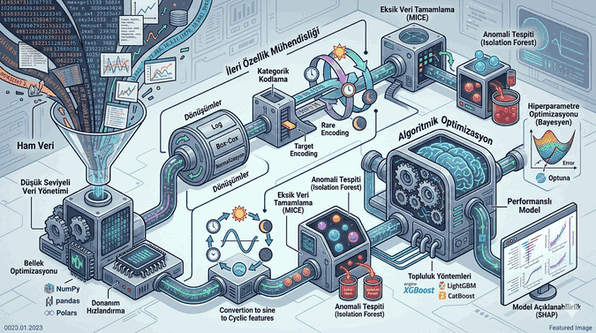
Figure 1: Unsupervised Learning: The Hidden Geometry of Data and Algorithmic Discovery Techniques.
1. Unsupervised Learning Paradigm and Mathematical Foundations
While the primary goal in supervised learning is to optimize the function $y = f(x)$, the focus in unsupervised learning is modeling the probability density function $P(x)$ or the intrinsic geometry of the data. The absence of labels in the dataset requires the model to construct its loss function based on the data’s own variance or distance metrics.
Data Representation and Distance Metrics
The success of algorithms depends on how we define “similarity” between data points. The most commonly used metrics are:
Euclidean Distance: Geometric proximity.
Manhattan Distance: Preferred in grid-based data structures.
Cosine Similarity: Used specifically in NLP processes to measure the directional similarity of vectors.
2. Clustering Strategies
Clustering is the process of partitioning data into homogeneous subgroups. The goal here is to maximize intra-cluster similarity while minimizing inter-cluster similarity.
2.1. K-Means Algorithm and Optimization
K-Means is a centroid-based iterative algorithm. The process begins by assigning $k$ random centers and continues by minimizing the sum of squared errors (Inertia) within clusters.
Technical Note: The “Elbow Method” or “Silhouette Score” analysis plays a critical role in determining the $k$ value.
Hierarchical methods organize data in a tree structure (Dendrogram). There are two main approaches:
Agglomerative (Bottom-Up): Each point is initially a cluster, and the closest clusters are merged.
Divisive (Top-Down): All data is a single cluster, and it progresses by splitting.
2.3. Density-Based Clustering: DBSCAN
Unlike K-Means, DBSCAN (Density-Based Spatial Clustering of Applications with Noise) does not require knowing the number of clusters in advance and automatically isolates noise (outliers). It is superior in separating clusters with complex geometric shapes.
3. Dimensionality Reduction
The “Curse of Dimensionality” encountered in high-dimensional datasets increases the computational cost of models and reduces their generalization ability. Dimensionality reduction decreases the number of features while preserving the essence of the data.
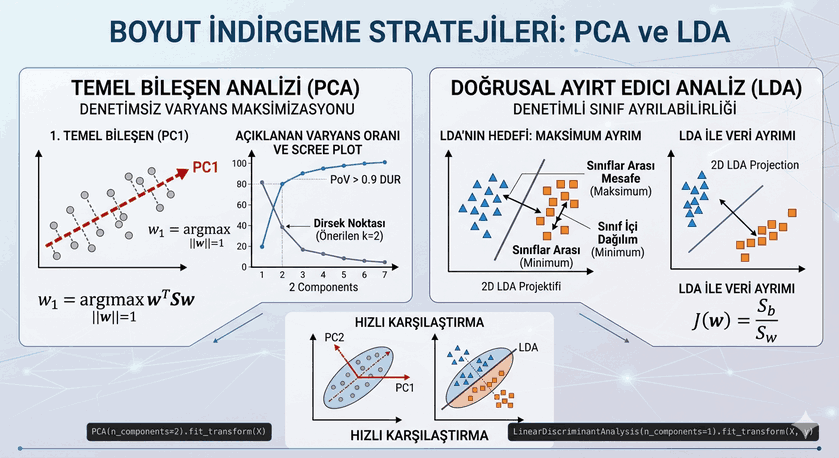
3.1. Principal Component Analysis (PCA)
PCA creates new orthogonal axes (Principal Components) that maximize the variance in the dataset. This process relies on the eigenvalue and eigenvector decomposition of the covariance matrix.
3.2. t-SNE and UMAP
Used for visualization purposes, these techniques aim to preserve neighborhood relationships from high-dimensional space when moving to low-dimensional (generally 2D or 3D) space. t-SNE is excellent for non-linear structures but has high computational cost; UMAP is faster and more successful at preserving the global structure.
from sklearn.decomposition import PCA
import pandas as pd
# An example of a high-dimensional dataset (e.g., 10 features)high_dim_data = np.random.normal(size=(100, 10))
# PCA application: Dimensionality reduction by preserving 95% of the informationpca = PCA(n_components=0.95)
reduced_data = pca.fit_predict(high_dim_data)
print(f"Original Dimension: {high_dim_data.shape[1]}")
print(f"Reduced Dimension: {reduced_data.shape[1]}")
4. Anomaly Detection
One of the most critical application areas of unsupervised learning is anomaly detection. It is used particularly in financial fraud, network security, and maintenance of industrial systems.
Isolation Forest: Builds random trees to isolate data points. Anomalies are isolated in shorter branches compared to normal data.
Local Outlier Factor (LOF): Compares the density of a point with its neighbors. Points in low-density regions are labeled as anomalies.
5. Software Ecosystem and Libraries
The core stack used in unsupervised learning projects consists of the following components:
Scikit-Learn: It is the industry standard. It contains optimized versions of algorithms such as KMeans, PCA, and DBSCAN.
PyTorch & TensorFlow: Used for neural network-based unsupervised structures like Autoencoders.
CuML (RAPIDS): Offers accelerated machine learning algorithms on GPU. It provides 10-50 times speed advantage over CPU on large datasets.
NetworkX / Gephi: Vital for modeling relationships between data using graph theory and performing Community Detection.
6. Modern Application: Autoencoders
In the world of deep learning, unsupervised learning comes to life with “Autoencoder” architectures. An Autoencoder reduces input data into a compressed representation form (Bottleneck/Latent Space) and then attempts to reconstruct the original data from this constrained information.
Components of the Architecture:
Encoder: Feature extraction and dimensionality reduction.
Latent Space: The most dense and meaningful summary of the data.
Decoder: Reconstructing the original input from the compressed data.
7. Technical Application Notes and Best-Practices
Engineering details to consider when developing unsupervised learning models include:
Feature Scaling: Since clustering algorithms are distance-based, the use of StandardScaler or MinMaxScaler is mandatory. Otherwise, features with large numerical values will dominate the model.
Variance Analysis: When applying PCA, the cumulative sum of the Explained Variance Ratio should be monitored. Generally, preserving between 80%-95% of the variance is targeted.
Sensitivity Analysis: Since unsupervised models lack an objective success metric (like Accuracy), results should be tested with different sets of parameters (hyperparameter tuning) and validated by domain experts.
Important Note: Unsupervised learning is often used as a “preprocessing” step before supervised learning processes. For example, dimensionality reduction techniques are employed to clean noise in raw data or to prevent model overfitting by reducing the number of features.
Unsupervised learning methods enable data scientists to derive strategic insights from raw information by bringing to light hierarchies and structures hidden within the data. These algorithms are the only solution path in scenarios where labeling costs are high, especially in large-scale systems.