We use cookies and other tracking technologies to improve your browsing experience on our website, to show you personalized content and targeted ads, to analyze our website traffic, and to understand where our visitors are coming from.
⚠️
GDPR & Cookie Policy Notice
In accordance with data protection regulations; the use of mandatory cookies is required for the core functions of our website to operate, ensure data security, and perform analytics. If you reject the use of cookies, it is not possible to benefit from the services on our website due to technical limitations and data synchronization interruptions. You must consent to the use of cookies to access the content on our site.
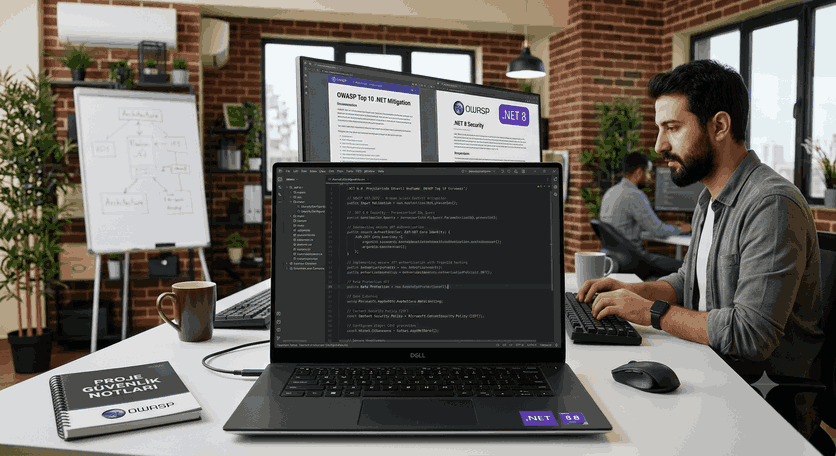
Professional Debugging Strategies and In-Depth Analysis Techniques in Embedded Systems Development
Debugging in the world of embedded systems requires overcoming obstacles such as hardware constraints, real-time requirements, and limited visibility, unlike standard desktop software. The question “The code is running, but why is the system locking up?” is the nightmare of every embedded software engineer. In this article, advanced techniques, code examples, and hardware architectures used to quickly detect errors and stabilize the system in modern embedded projects are discussed.
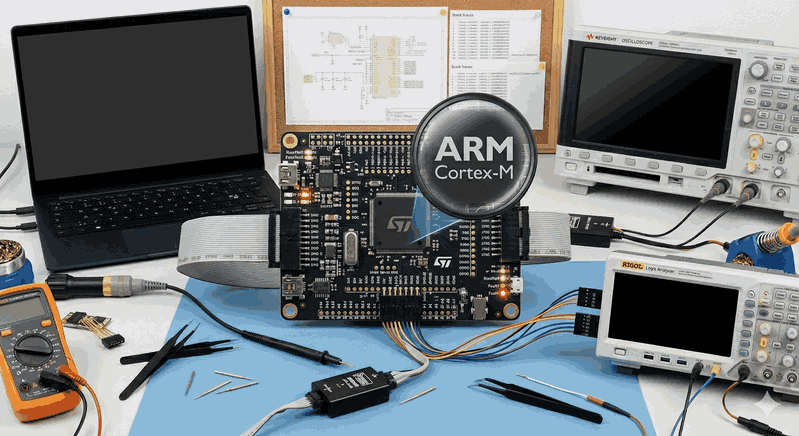
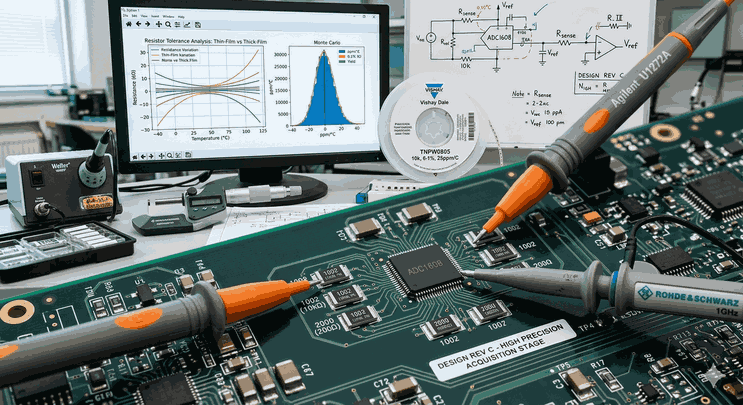
Figure 1: Professional Debugging Strategies and In-Depth Analysis Techniques in Embedded Systems Development.
1. Hardware-Level Monitoring: The Power of JTAG and SWD Protocols
JTAG (Joint Test Action Group) and SWD (Serial Wire Debug) interfaces, found in modern microcontrollers (STM32, ESP32, NXP, etc.), are the primary tools for understanding software behavior on hardware. It is not enough to just set a “breakpoint” and wait; you need to perform register-level analysis.
Advanced Breakpoint Usage
Most developers only perform line-based pausing. However, it is much more effective to use the Data Watchpoint and Trace (DWT) unit to stop the processor when a value at a specific memory address changes. This is especially unique for catching variables corrupted due to “Stack Overflow” or pointer errors.
// Register configuration to monitor an address with DWT in the ARM Cortex-M series (Representative)
voidsetup_watchpoint(uint32_t address) {
CoreDebug->DEMCR |= CoreDebug_DEMCR_TRCENA_Msk; // Enable Trace unit
DWT->CYCCNT =0;
DWT->COMP0 = address; // Memory address to monitor
DWT->FUNCTION0 =0x00000001; // Stop when a write operation occurs
}
Note: The number of hardware breakpoints is limited (usually between 2 and 8). Therefore, using “Conditional Breakpoints” for complex logical errors allows you to perform filtering within the IDE.
2. Serial Wire Viewer (SWV) and ITM for Real-Time Analysis
Using the printf function over standard UART disrupts system timing (the Heisenbug effect). UART is relatively slow and keeps the processor busy. Instead, logs can be exported at much higher speeds and with almost no load on the CPU by using the Instrumentation Trace Macrocell (ITM) in the ARM architecture.
Logging Strategy
Logs should not just say “Error occurred,” but should also include context information about where the error happened.
#include"stm32f4xx.h"// Sending a character via ITM
int_write(int file, char*ptr, int len) {
for (int i =0; i < len; i++) {
ITM_SendChar((*ptr++));
}
return len;
}
// Usage example
voidDMA_IRQHandler(void) {
if (DMA1->HISR & DMA_HISR_TEIF4) {
printf("[ERROR] DMA Transfer Error at Tick: %lu\n", HAL_GetTick());
}
}
3. Signal Integrity Check with Oscilloscopes and Logic Analyzers
The correct operation of software depends on clean signals at the physical layer. A lack of pull-up resistors on I2C lines or noise in the SPI clock frequency leads to nonsensical errors in the software.
Logic Analyzer: Used to catch protocol-based errors (e.g., a sensor not sending an ACK).
Oscilloscope: Essential for viewing signal rise times and voltage fluctuations.
Critical Note: By adding “Toggle GPIO” commands to the entry and exit of specific functions within the software, you can measure how long the function takes with microsecond precision using an oscilloscope. This is vital for jitter analysis in systems using an RTOS (Real-Time Operating System).
4. Diagnosing Memory Errors: HardFault and Stack Analysis
The most common cause of lockups in embedded systems is HardFault exceptions. Situations such as invalid memory access, unaligned data reading, or division by zero cause this.
Writing a HardFault Handler
Instead of the default infinite loop, it is necessary to build a structure that dumps the register values (R0-R12, LR, PC, PSR) at the time of the error. These values show exactly which assembly instruction the error occurred in.
voidHardFault_Handler(void) {
__asmvolatile (
" tst lr, #4 \n"" ite ee \n"" m r0, msp \n"" m r0, psp \n"" ldr r1, [r0, #24] \n"" b prve_hardfault_args \n" );
}
voidprve_hardfault_args(unsignedint* args) {
// args[6] gives us the Program Counter (PC) value.
// Searching for this address in the .map file finds the source of the error.
while(1);
}
5. RTOS Monitoring and Resource Consumption Audit
If you are using an operating system like FreeRTOS, Azure RTOS, or Zephyr in your project, the debugging dimension extends to the “Task” level.
Stack High Water Mark: Monitor the maximum amount of stack used by each task. The uxTaskGetStackHighWaterMark() function tells you how close the stack is to overflowing.
Priority Inversion: This is a situation where a low-priority task blocks a high-priority task. Ensure that the “Priority Inheritance” feature is active during mutex usage.
6. Remote Debugging and Embedded Unit Testing
Debugging is difficult after the system has been deployed to the field. Therefore, the Watchdog Timer (WDT) should be used not only to reset the system but also to save status information to non-volatile memory (EEPROM/Flash) before resetting.
Software-Based Techniques
Assert Usage: Check critical parameters with assert() during the development phase.
Unit Test Frameworks: Use libraries such as Unity or CppUTest to test logic layers independent of the hardware in simulation.
In embedded systems, the debug process is not just a tool usage; it is a methodology. First, it should be determined whether the problem is deterministic (repeatable). Then, narrowing should be done with a layered approach (Hardware -> Signal -> Protocol -> Software Architecture).
A good embedded developer should know how to read debug symbols (the DWARF format inside the .elf file) and the memory map (the .map file). Remember that the most complex errors are usually based on “assumptions.” Always verify the data (register content, oscilloscope output).
List of Important Libraries and Tools:
SEGGER Ozone: A very powerful visual debugger.
ST-Link Utility / STM32CubeProgrammer: For memory dump operations.
Unity Test: A unit test library optimized for the C language.
When these in-depth techniques are applied, debug time can be reduced from days to hours, and the reliability of the product in the field (MTBF - Mean Time Between Failures) can be maximized.