We use cookies and other tracking technologies to improve your browsing experience on our website, to show you personalized content and targeted ads, to analyze our website traffic, and to understand where our visitors are coming from.
⚠️
GDPR & Cookie Policy Notice
In accordance with data protection regulations; the use of mandatory cookies is required for the core functions of our website to operate, ensure data security, and perform analytics. If you reject the use of cookies, it is not possible to benefit from the services on our website due to technical limitations and data synchronization interruptions. You must consent to the use of cookies to access the content on our site.
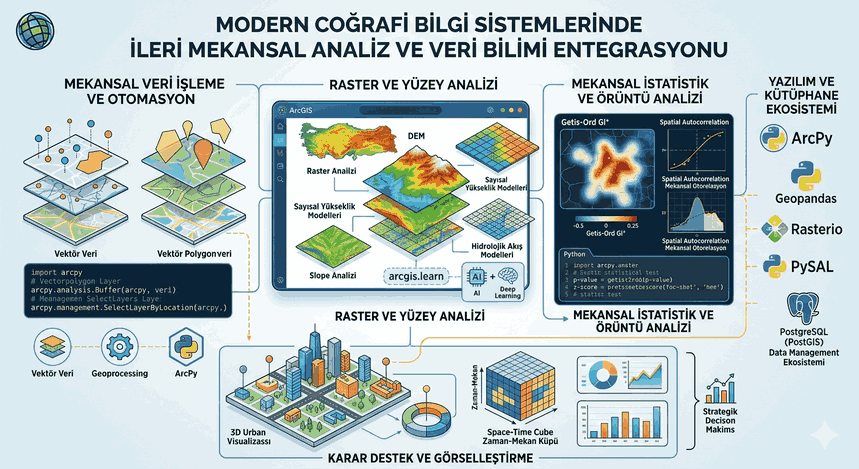
Advanced Spatial Analysis and Data Science Integration in Modern Geographic Information Systems
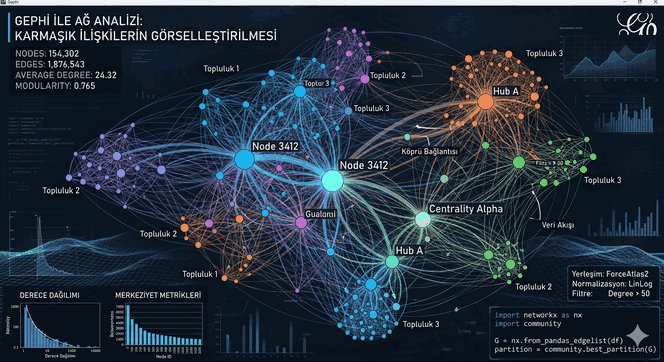
Incorporating the location parameter into data-driven decision-making processes is one of the most critical stages in transforming raw data into strategic insights. Today, the ArcGIS ecosystem has evolved beyond offering only static mapping tools; it has become a massive analytical platform blended with Python-based libraries, deep learning models, and complex spatial statistics.
Figure 1: Advanced Spatial Analysis and Data Science Integration in Modern Geographic Information Systems.
Architectural Foundations of Spatial Analysis and Vector Data Processing
Spatial analysis is the art of processing the spatial relationships (topology) of objects on Earth, their distances from each other, and the qualitative data carried by these objects using mathematical models. Within the ArcGIS platform, this process is managed through a sequence of processing steps called “Geoprocessing.”
From a technical perspective, a spatial analysis process is not just about creating a buffer; it is about finding the most optimized access path using Euclidean distance or network-based cost-distance algorithms. In vector-based analyses, the ArcPy library sits at the center of automation and technical precision.
Geoprocessing Automation with ArcPy
ArcPy allows us to manage all of ArcGIS’s analytical capabilities through Python scripts. The code example below technically simulates the process of density analysis in a specific study area and the filtering of the results:
import arcpy
# Defining workspace and environment variablesarcpy.env.workspace ="C:/Analiz/VeriMerkezi.gdb"arcpy.env.overwriteOutput =True# Input layerspoint_data ="su_kaynaklari"buffer_distance ="500 Meters"output_layer ="koruma_alanlari_buffer"try:
# 1. Buffer Analysis print("Creating spatial buffer...")
arcpy.analysis.Buffer(point_data, output_layer, buffer_distance, "FULL", "ROUND", "LIST")
# 2. Select by Location# Detection of structures remaining within the protection zone structures ="mevcut_yapilar" arcpy.management.SelectLayerByLocation(structures, "INTERSECT", output_layer)
# Check the number of selected records count = int(arcpy.management.GetCount(structures).getOutput(0))
print(f"Number of affected structures: {count}")
except arcpy.ExecuteError:
print(arcpy.GetMessages(2))
Raster Analysis and Pixel-Based Surface Modeling
While vector data represents discrete objects, raster data represents continuous surfaces (such as temperature, elevation, or pollution rates). “Spatial Analyst” operations conducted on ArcGIS are based on the principles of Map Algebra.
Especially in analyses performed on Digital Elevation Models (DEM); slope, aspect, and hydrological flow models are of strategic importance. At a technical level, these analyses are carried out with local, focal, and zonal operators that calculate the value relationship of each cell with neighboring cells.
ArcGIS API for Python and Big Data Approach
In modern GIS projects, cloud-based and distributed systems are coming to the fore rather than desktop software. The arcgis.learn module works integrated with libraries such as PyTorch and TensorFlow to perform object detection and semantic segmentation on raster data.
Spatial Statistics and Pattern Analysis
The true power that elevates spatial analysis beyond a mere visual presentation is spatial statistics. The principle of “Spatial Autocorrelation” assumes that objects close to each other carry more similar characteristics than those far away.
Strategic Techniques:
Hot Spot Analysis (Getis-Ord Gi):* Identifies statistically significant clusters in the data. It reveals whether an event (e.g., crime rates or disease spread) occurs randomly or within a pattern.
Geographically Weighted Regression (GWR): Unlike standard regression models, it allows the coefficients of variables to vary according to location. This is a critical tool for understanding local dynamics.
Note: In spatial analyses, “p-value” and “z-score” values are a technical necessity to verify whether the patterns found are coincidental.
Software Resources and Modern Library Ecosystem
Relying solely on the ESRI ecosystem when working with ArcGIS can limit a data scientist’s capabilities. A hybrid approach offers more flexible solutions:
Geopandas: The standard for processing vector data in a tabular logic (DataFrame) in Python.
Shapely: Used for mathematical calculations of geometric operations (intersection, union).
Rasterio: Provides high performance in the process of reading raster data and converting it into numpy arrays for processing.
PySAL: An advanced spatial statistical analysis library; it is an excellent assistant for verifying ArcGIS models.
Data Visualization and Cartographic Meaning
The technical success of the analysis is directly related to how it is presented to the end user. The 3D analysis capabilities (Voxel layers) and “Space-Time Cubes” offered by ArcGIS Pro allow us to visualize the change of data over time.
Strategically, a map is not just a “picture,” but a “decision support interface.” In a technical reporting process, the symbology standards used (RGB, HEX codes) and the legend hierarchy directly affect the readability of the data.
Advanced Data Engineering and ETL Processes
Spatial data analysis usually begins with cleaning dirty and raw data. Coordinate system transformations (Projection), resolving topological errors, and attribute table manipulations determine the accuracy of the analysis.
SQL and GIS Integration
In enterprise-level GIS projects, data is usually kept in databases such as PostgreSQL (PostGIS) or Oracle (SDE). Spatial SQL queries allow us to perform spatial filtering among millions of records:
-- SQL example that brings stations within 10km distance to a specific point
SELECT name, ST_Distance(geom, ST_GeomFromText('POINT(28.97 41.01)', 4326)) as distance
FROM istasyonlar
WHERE ST_DWithin(geom, ST_GeomFromText('POINT(28.97 41.01)', 4326), 10000)
ORDERBY distance;
Conclusion: Spatial Strategies of the Future
Spatial analyses performed with ArcGIS are no longer the monopoly of city planners or map engineers today. From logistics to retail, from the defense industry to climate change modeling, location data is an asset that provides a competitive advantage.
The strategic way to make sense of data on a map involves selecting the right mathematical model, automating the process with appropriate software libraries, and verifying the results with scientific statistical methods. Together with the integration of artificial intelligence and machine learning, the concept of “Spatial Intelligence” will continue to be one of the strongest arms of digital transformation.
Technical Note: Always consider the differences between WGS84 (Global) and UTM (Local) projections in your analyses. Choosing the wrong projection can lead to errors of up to 20% in distance and area calculations.
Reference List of Key Libraries:
ArcPy: Desktop automation and geoprocessing.
ArcGIS API for Python: Web-based analysis and data management.
NumPy & Pandas: Data manipulation and matrix operations.
Scikit-learn: Spatial clustering and classification models.