We use cookies and other tracking technologies to improve your browsing experience on our website, to show you personalized content and targeted ads, to analyze our website traffic, and to understand where our visitors are coming from.
⚠️
GDPR & Cookie Policy Notice
In accordance with data protection regulations; the use of mandatory cookies is required for the core functions of our website to operate, ensure data security, and perform analytics. If you reject the use of cookies, it is not possible to benefit from the services on our website due to technical limitations and data synchronization interruptions. You must consent to the use of cookies to access the content on our site.
Topological Approaches in Data Science and Graph Theory-Based Network Analysis with Gephi
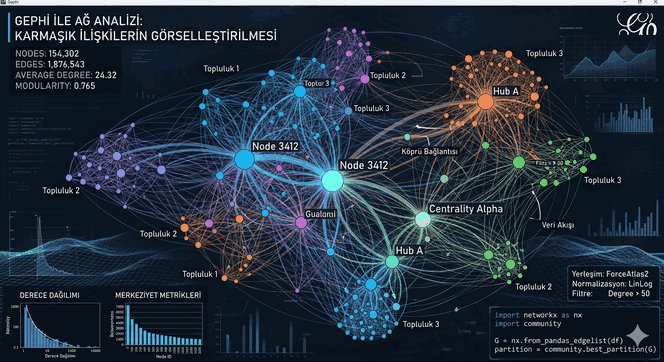
In today’s data ecosystem, identifying relational patterns between the units that make up the data is of strategic importance rather than just the size of the raw data. Traditional relational databases and row-column-based analysis methods are insufficient to express the phenomenon of “connectivity.” This is where Graph Theory comes into play. This discipline, which models complex systems through nodes and edges, transforms into a massive analytical power that uncovers hidden topologies in big data sets when combined with open-source tools like Gephi.
Figure 1: Topological Approaches in Data Science and Graph Theory-Based Network Analysis with Gephi.
1. Mathematical and Technical Foundations of Network Analysis
A network analysis process begins mathematically with the construction of a graph $G = (V, E)$, where $V$ (Vertices) represents the actors constituting the system, and $E$ (Edges) represents the interactions between these actors. Gephi uses a Java-based engine to process this mathematical structure and converts topological distances into physical coordinates using various Layout Algorithms while visualizing the data.
Mastering fundamental metrics in network analysis is essential to make inferences beyond visualization:
Degree Centrality: The total number of edges connected to a node. In directed graphs, it is divided into “In-degree” and “Out-degree.”
Betweenness Centrality: The frequency with which a node lies on the shortest paths between all other node pairs in the network. These nodes act as “bridges” in the network and control the flow of information.
Closeness Centrality: The average distance from a node to all other nodes in the network. It indicates how central a node is within the network.
Modularity: Measures the community structure of the network. A high modularity score indicates that the network is divided into sub-groups that are densely connected within themselves but sparsely connected to the outside.
2. Data Preparation and ETL Processes for Gephi
Before importing data into Gephi, it must be cleaned and converted into appropriate formats (CSV, GDF, GEXF). In large datasets, this process is usually performed using Python libraries such as Pandas and NetworkX.
Below is an example Python script that converts a dataset into “Nodes” and “Edges” tables that Gephi can read:
import pandas as pd
import networkx as nx
# Loading the raw dataset (e.g., Social media interactions)raw_data = pd.read_csv('interaction_log.csv')
# Defining source and target# df structure: source_user, target_user, weightedges = raw_data[['source_user', 'target_user', 'weight']]
# Creating a NetworkX objectG = nx.from_pandas_edgelist(edges, source='source_user', target='target_user', edge_attr='weight')
# Creating the node list (along with attributes)nodes = pd.DataFrame(G.nodes(), columns=['ID'])
nodes['Label'] = nodes['ID']
# Exporting in Gephi formatnodes.to_csv('nodes_table.csv', index=False)
edges.to_csv('edges_table.csv', index=False)
The most critical point to pay attention to at this stage is the cleaning of noise in the dataset. Isolated nodes or edges with very low weights can cause a “hairball” effect in visualization, making analysis impossible.
3. Dynamic Layout Algorithms and Force-Directed Visualization
The heart of Gephi beats in the layout tab. These algorithms, which transform static data into a living organism, are based on physical force simulations.
ForceAtlas2: A non-linear algorithm optimized for large networks. It positions nodes with repulsion force and edges with attraction force. This algorithm clarifies structural gaps by pushing communities away from each other.
Fruchterman-Reingold: Treats nodes like atoms and tries to minimize the energy between them. It offers more aesthetic and balanced distributions but has a high computational cost for very large datasets.
OpenOrd: Used to quickly detect clusters in very large-scale networks (millions of nodes).
Technical Note: When working with large datasets, increasing the Gravity parameter prevents nodes from dispersing, while the Scaling parameter opens up the distance between clusters, providing the opportunity for detailed examination.
4. Statistical Calculations and Filtering Techniques
After visualization, the “Statistics” tools on the right panel of Gephi should be run. Specifically, running the Modularity algorithm generates “Class” data for coloring the nodes.
In the filtering phase, the network should be simplified using Topology filters. For example, showing only nodes with a Degree value greater than 5 allows focusing on the core structure of the network. The Giant Component filter makes it possible to work on the main structure by eliminating small groups detached from the network.
5. Software Ecosystem and Library Integration
Network analysis is not limited to Gephi. In complex projects, while Gephi is used as a “visual inspection” layer, different libraries play a role in the computational layer:
NetworkX (Python): Standard for prototyping and basic analytical calculations.
iGraph (C/C++/R/Python): Preferred for high-performance calculations and complex algorithms (e.g., Walktrap, InfoMap).
Graph-tool (C++ / Python): Thanks to OpenMP support, it can analyze massive networks in seconds on multi-core processors.
Sigma.js / D3.js: JavaScript libraries used to publish analyses prepared in Gephi interactively in web environments.
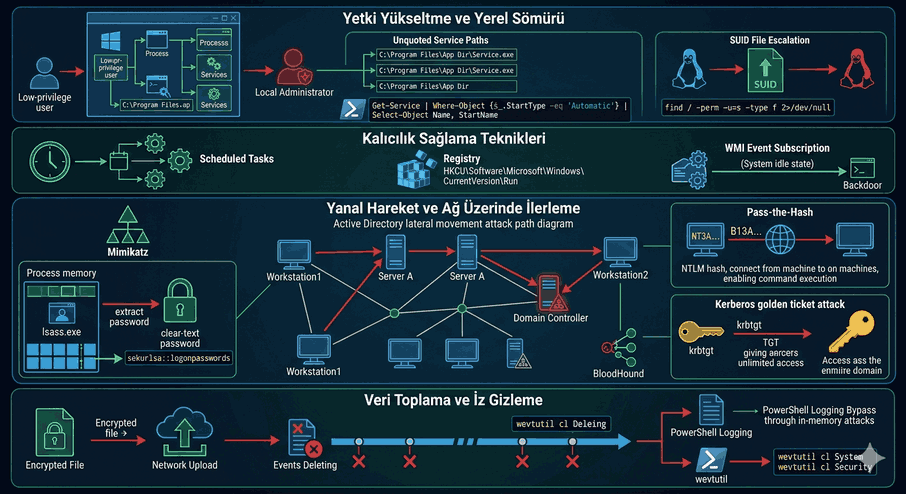
6. Network Topology in Cybersecurity and Malware Analysis
Beyond data science, network analysis plays a critical role in cybersecurity. The relationships between API calls of a malware sample in a system can be modeled as a graph.
For instance, the functions imported by a Windows PE file and the sequence in which these functions call each other create a directed graph. In analyses conducted with Gephi, the “functional signatures” (behavioral analysis instead of signature-based detection) of malicious software can be detected through the topological similarities of these graphs. Similarly, in network traffic analysis (PCAP data), traffic density between IP addresses can be imported into Gephi to visualize botnet structures or DDoS attack centers in seconds.
7. Conclusion and Strategic Inferences
Network analysis with Gephi is a methodology of exploratory data analysis (EDA) rather than just a data visualization process. By bringing order to the chaos within complex systems, this tool presents decision-makers with the system’s weak points, most influential actors, and hidden sub-groups.
Important Notes:
Data Format: Always prefer the .gexf format; because this format supports hierarchical structures and dynamic (time-dependent) data.
Scalability: Gephi is a RAM-based tool. Remember to increase Java memory settings (the Xmx value from the gephi.conf file) for analyses on 100,000+ nodes.
Interpretation: A graph alone means nothing. Be sure to support the visualization with centrality metrics and statistical tests (p-value, distribution analyses).
Network analysis allows us to see the “context” within data. Gephi is the most powerful instrument that turns this context into a work of art and a strategic report. By using software resources correctly and remaining loyal to mathematical foundations, even the most complex relationships can become solvable.